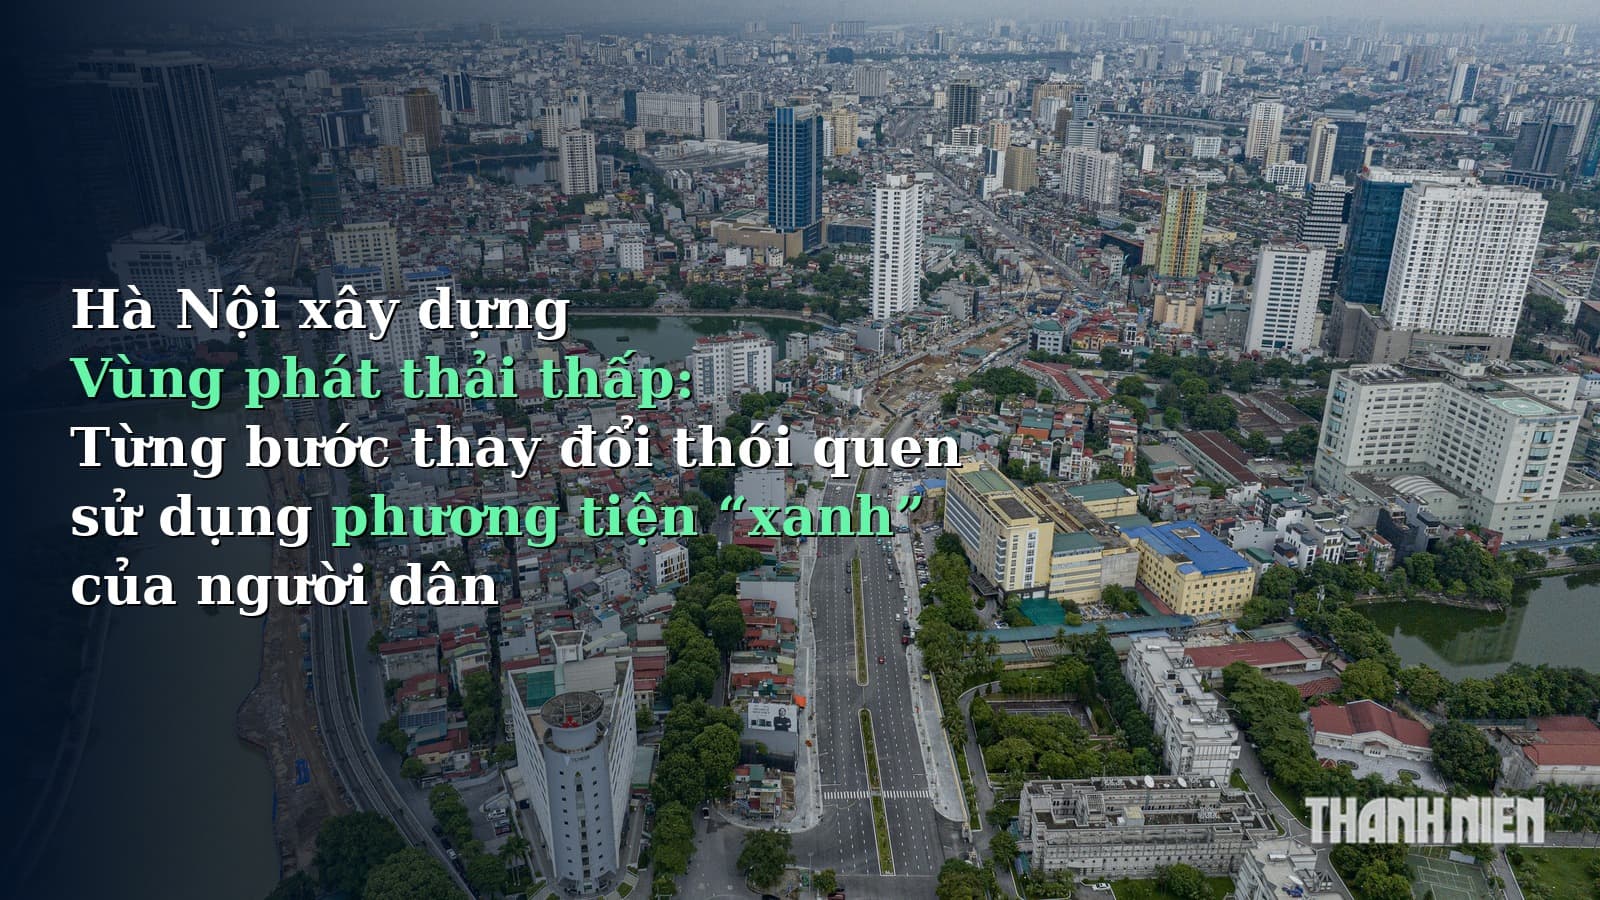


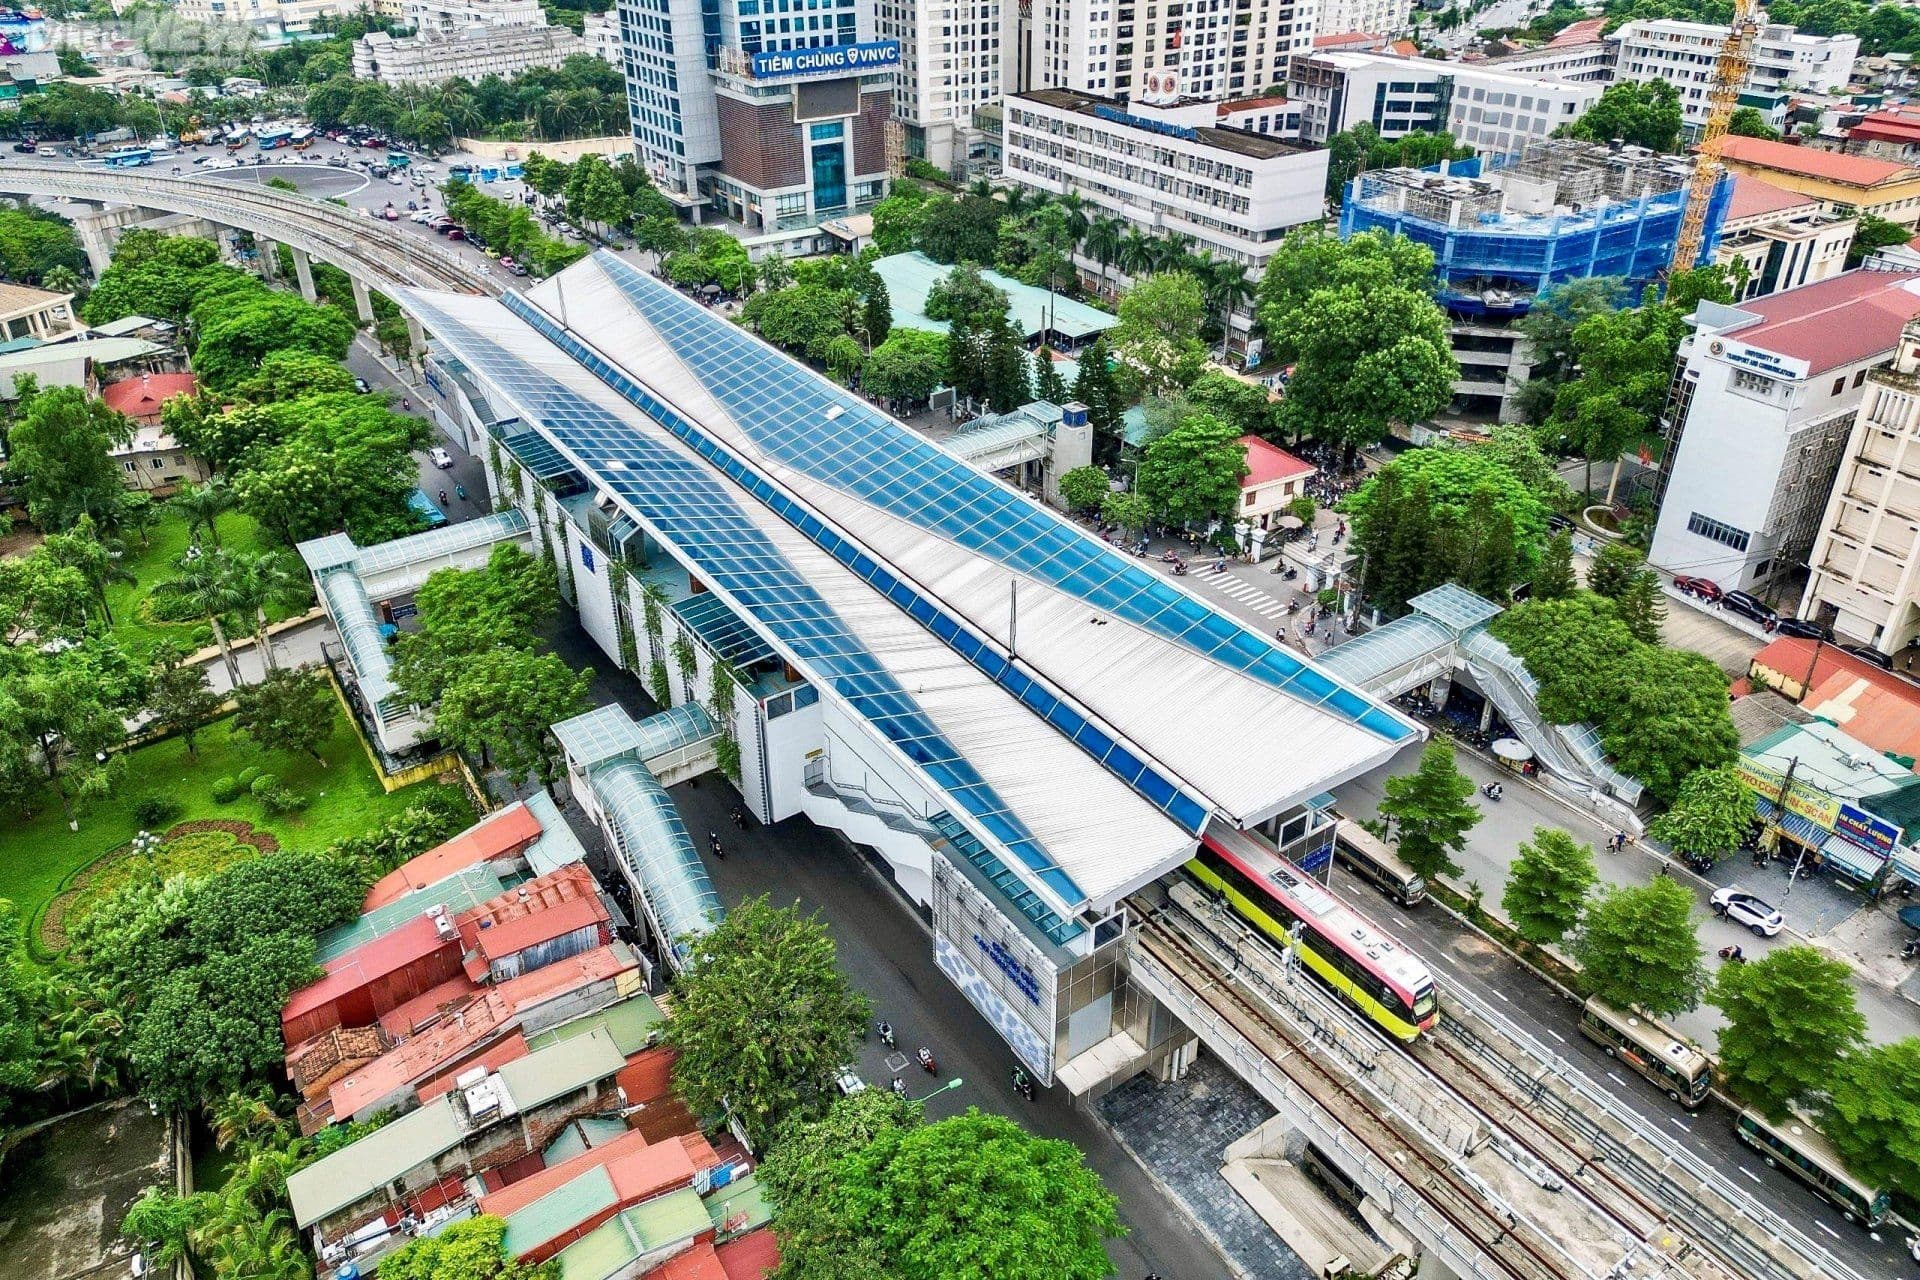
Amid explosive urbanization, increasing pressures from congestion, air pollution, and climate change pose existential challenges for major cities. The transit-oriented development model, commonly known as TOD, has become an overarching planning philosophy and a key driver helping cities restructure their spaces, reduce their carbon footprints, and move towards sustainable green development.
What is the TOD urban model?
Unlike the simplistic notion that TOD is merely building residential areas or commercial towers near bus stops or metro stations, this model is actually a strategic integrated spatial planning approach.
Core concept and operating philosophy
The TOD model uses high-capacity public transport hubs as central anchors to organize surrounding urban spatial development. Within a comfortable walking radius—typically ranging from 400 meters for bus stops to 800 meters for urban rail stations—cities are designed compactly with high density, integrating diverse functions from housing, offices, and shopping centers to public services and green parks.
The philosophy of TOD is to bring daily living amenities closer to residents' homes, enabling people to easily walk or cycle to public transport stations without relying on private motorized vehicles.
Evolution through generations from TOD 1.0 to TOD 5.0
The global TOD model has undergone a continuous development process across five generations:
- TOD 1.0 version: The initial formation period associated with the emergence of standalone railway stations in traditional urban spaces.
- TOD 2.0 and 3.0 versions: Cities began focusing on integrating commercial functions and services adjacent to stations and organizing multimodal transportation.
- TOD 4.0 version: Expanding integrated planning for underground spaces, overhead spaces, and complex connections of large shopping centers directly into station concourses.
- TOD 5.0 version: This is the most advanced current generation, where the station is likened to the heart of the community. TOD 5.0 comprehensively integrates ecological factors, smart technology, circular economy, and social cohesion, ensuring a livable environment with zero emissions.
Hierarchy of scale application in urban planning
The TOD model can be flexibly deployed at three different scale levels:
- Super-city level: Integrating land-use planning and transportation models across the entire city space, implementing compact city scenarios that deliver long-term sustainable efficiency.
- Transportation corridor level: Planning and developing land funds along key public transport routes to promote two-way movement flows, balancing travel demand between the central area and satellite cities.
- Station level: Focusing on establishing high-quality public spaces around specific stations, optimizing opportunities for travel by non-motorized means such as walking and cycling.
TOD planning criteria framework from 3D, 5D to urban indicator systems
Initially, planners established a three-D criteria framework including building density, land-use diversity, and pedestrian-friendly urban design. Later, this framework was expanded into a five-D criteria framework by adding two elements: destination accessibility and distance to public transport stations.
To materialize this into planning work, the criteria system is proposed for deployment through main technical indicator groups:
- Density group: Including population density, commercial density, and land-use density.
- Walking and cycling capability group: Measured by the length of dedicated pedestrian paths, access coverage area, bicycle lane length, and intersection density.
- Public transport service capacity group: Evaluated by vehicle capacity utilization coefficients during peak and off-peak hours.
- Service quality and friendliness level group: Measuring safety levels at stops, station amenities, passenger information systems, trip frequency, and transfer capability.
- Auxiliary infrastructure group: Capacity to supply centralized parking spaces for bicycles, motorbikes, and personal cars at connection points.
Specific differences between developed and developing cities
The application of TOD needs to account for essential differences among country groups.
In developed cities, natural population density is low or medium, and personal car ownership rates are very high. Therefore, applying TOD focuses on moderate-density re-planning and attracting citizens to switch from cars to buses or trains.
In developing cities, natural population density is already very high, and land-use formats already feature mixed functions. Private car ownership rates are growing rapidly, but motorbikes still dominate. Therefore, TOD in these cities plays a role in reorganizing spatial order, preventing pollution, and building feeder bus systems that connect effectively with urban railways.
Core driving forces for emission reduction and sustainable development
The TOD model brings tremendous positive impacts across all three economic, social, and environmental pillars:
Directly minimizing greenhouse gas emissions and air pollution
Road transport is one of the largest sources of carbon emissions and particulate matter in cities. By encouraging citizens to switch from private vehicles to urban rail or bus rapid transit, TOD significantly reduces total motorized trips and vehicle travel kilometers. This directly cuts fossil fuel consumption, lowers toxic emission concentrations, and improves urban air quality.
Controlling urban sprawl and conserving land resources
Compact urban planning under the TOD model helps concentrate economic, commercial, and residential activities around transport hubs. This method prevents spontaneous suburban sprawl, preserving agricultural land and natural green spaces. Additionally, concentration helps reduce investment and operational costs for technical infrastructure systems such as water supply and drainage, electricity, and telecommunications.
Creating a green lifestyle and improving public health
TOD focuses on human-centric spatial design with wide sidewalks, shading trees, dedicated bicycle lanes, and safe walking areas. Turning walking and cycling into daily commuting methods helps residents increase physical activity, minimize urban chronic diseases, and improve quality of life.
Capturing land value increment to reinvest in infrastructure
TOD development creates enormous added value for land funds around stations. According to market research data, real estate projects located near urban railway lines in Ho Chi Minh City and Hanoi always record superior price growth compared to the general baseline, typically reaching about 19% in Hanoi compared to the 12% market-wide average during the same period. Local authorities can use financial tools such as land auctions, infrastructure improvement fees, or public-private partnerships to capture this financial source and reinvest in the development and operation of public transport networks.
International experience in developing the TOD urban model
The US and Western cities
A extensive study by expert Robert Cervero conducted across 100 TOD projects in the US recorded specific application structures: 37.4% of models deployed in subway areas, 31.3% applied to light rail, 21.8% applied to commuter rail, 7.8% applied to bus systems, and 1.7% applied at ferry terminals. Over 90% of TOD models in the US are associated with rail due to the permanent nature of the infrastructure, making it easy to attract investors.
Post-implementation evaluation results in the US show that areas applying TOD criteria reduced total trips and total vehicle travel kilometers by 3% to 5% compared to before, while achieving an average reduction of about 30% compared to cities not developed under the TOD model.
In Europe and Australia, the Scania region in Sweden has succeeded in creating a multi-nucleated urban structure with major cities as drivers for regional development through interconnected transport networks. Lisbon, Portugal develops major transport hubs at the border areas between suburbs and the center to route railways outward. Meanwhile, Sydney, Australia focuses on developing land use along priority corridors combined with bus rapid transit systems. In South Korea, the capital Seoul manages compact urban growth focused within a 1-kilometer radius from railway stations.
Typical benchmark model in Japan
Japan is a country that has brought the TOD model to an exemplary level of development. The 23 inner-city wards of Tokyo alone possess 42 railway lines with a total length of up to 2,246 km, transporting an average of over 16 million passenger trips daily.
Shibuya Station is evaluated as Tokyo's largest TOD urban area, integrating lines from major railway companies such as JR East, Tokyo Metro, Tokyu, and Keio. The area around the station is planned with high-density mixed uses, directly connecting commercial and service buildings without gaps.
Shinjuku Station is one of the busiest transportation hubs in the world with 7 major railway lines, 8 stations, and over 200 exits. Daily, Shinjuku Station welcomes about 3.4 million passenger trips. A network of underground corridors and overhead pedestrian bridges directly connects the station with basement shopping centers, creating an underground and surface urban ecosystem operating with extreme fluency.
Rail-plus-property model in Hong Kong
Hong Kong is world-famous for its Rail-plus-Property strategy. Through practical research, Hong Kong classifies TOD into four characteristic spatial models:
- Moderate housing quantity: Tsing Yi station area with a population density of 358 people per hectare, mixed land-use index reaching 22%, located 11.4 km from the commercial center.
- High-density concentrated housing: Tai Koo station area with a population density reaching 596 people per hectare, mixed index reaching 36%, 8.8 km from the center.
- High-density offices: Central station area with a population density at 126 people per hectare, mixed index reaching 30%, located right in the urban center.
- High-density mixed land use: Tseung Kwan O station area with a population density of 569 people per hectare within a 500-meter range, mixed index up to 62%, 11.4 km from the center.
A representative TOD project at Kowloon Station in Hong Kong has a surface area of 13.54 hectares, but a total gross floor area exceeding 1 million square meters. This area concentrates 5,809 residential apartments, over 72,000 square meters of serviced apartments, over 231,000 square meters of offices, over 82,000 square meters of shopping centers, and 5,400 parking spaces. Regarding connection design, structures within a 200-meter radius are linked by station podium parks, while those within a 200 to 500-meter radius are entirely connected by elevated pedestrian bridge systems.
Lessons learned and orientations for Vietnamese cities
For developing cities like Vietnam, which have high population densities, large private vehicle ownership rates, and urban railway systems in the formation process, applying TOD requires filtering appropriate practical lessons.
To successfully develop the TOD model in Vietnamese cities, it is first necessary to implement integrated planning a step ahead, in which public transport planning and land-use planning must be prepared, appraised, and approved synchronously, while treating urban railways as a spatial structure-shaping tool rather than just a standalone transport infrastructure project.
Along with that, the early issuance of a distinct set of TOD technical standards and criteria suited to domestic characteristics will help clearly regulate population density, floor area ratio, mixed-use land ratio, and walking access radius for each station level.
Regarding management, localities need to finalize legal institutions and land financial mechanisms by effectively exploiting new policy frameworks such as the Railway Law to implement land value capture mechanisms, combined with public auctions of land funds around stations to generate reinvestment capital for the public transport system.
Additionally, urban design work must focus on developing soft infrastructure and small-scale parceling with a network of narrow streets to increase walking connectivity, while improving sidewalks, developing bicycle lanes, and arranging transfer parking lots right at terminal hubs.
Finally, TOD development must always ensure social equity by integrating social housing and affordable housing around the station area, thereby enabling middle- and low-income residents to easily access high-quality public transport services.
The TOD urban model is not merely a traffic technical solution but a comprehensive urban spatial restructuring strategy. Persistently pursuing the TOD orientation will help Vietnamese cities optimize land resource allocation, minimize environmental pollution, cut greenhouse gas emissions, and build a civilized, modern, and sustainable living space for future generations.
References
- Phát triển đô thị theo mô hình TOD: Hướng đi tất yếu cho một Thủ đô hiện đại — Báo Điện tử Chính Phủ
- Nghiên cứu mô hình TOD đối với các tuyến đường sắt đô thị tại Thành phố Hà Nội — Tạp chí Xây dựng - Bộ xây dựng
- Quy hoạch TOD hướng tới phát triển bền vững: bài học cho Hà Nội — Tạp chí Quy hoạch xây dựng số
- TOD không đơn thuần là việc xây dựng các khu dân cư gần ga tàu — VnEconomy
- TOD: Cuộc cách mạng tái cấu trúc đô thị — VnEconomy
- Phó Trưởng ban Quản lý đường sắt đô thị Hà Nội Nguyễn Bá Sơn: TOD là lời giải quan trọng cho bài toán phát triển bền vững — Báo Hànộimới
- Đường sắt đô thị và TOD: Lời giải bền vững cho ùn tắc giao thông — Báo Hànộimới